Fibonacci Trading Strategy – 0.618 Support Rejection
This fibonacci trading strategy example shows how price reacted at the 0.618 retracement level after a strong bullish move on EURUSD.
The setup uses Fibonacci support, a controlled pullback, and a rejection candle for entry confirmation. The replay focuses on clean structure, realistic market behavior, and simple observation without hype or prediction.
Both a full explanation video and a short looping replay version are included below.
📊 Market Context
Before the pullback, EURUSD moves higher with strong bullish momentum. Price creates a clear impulse move and then begins to retrace lower.
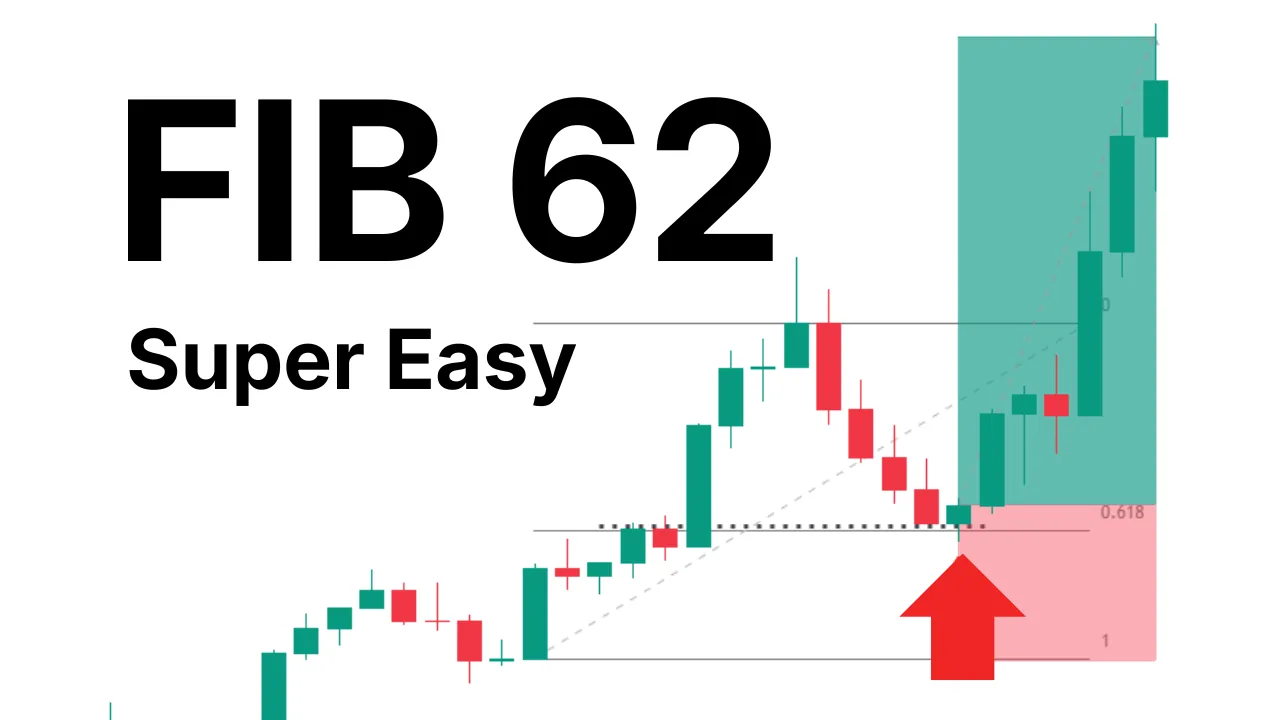
The Fibonacci retracement is drawn using the candle bodies from the bullish move. During the pullback, price approaches the 0.618 Fibonacci level while also interacting with a previous support area.
This creates a zone where many traders may start watching for possible continuation behavior.
The chart structure remains bullish because the market continues to hold above the deeper retracement area while momentum slows during the pullback.
📈 Setup Logic
This fibonacci trading strategy focuses on the 0.618 retracement level combined with support and rejection behavior.
As price pulls back into the retracement zone, the candles begin to lose bearish momentum. A rejection forms directly at the 0.618 area, showing that buyers may still be active near support.
The entry is taken on the close of the rejection candle after price stabilizes around the Fibonacci level.
The setup becomes stronger because several factors align together:
- bullish impulse move
- Fibonacci retracement
- support interaction
- rejection candle behavior
- continuation structure
Instead of entering randomly during the pullback, the setup waits for price to react at a specific area first.
🛡 Risk Management
Risk management is kept simple in this example.
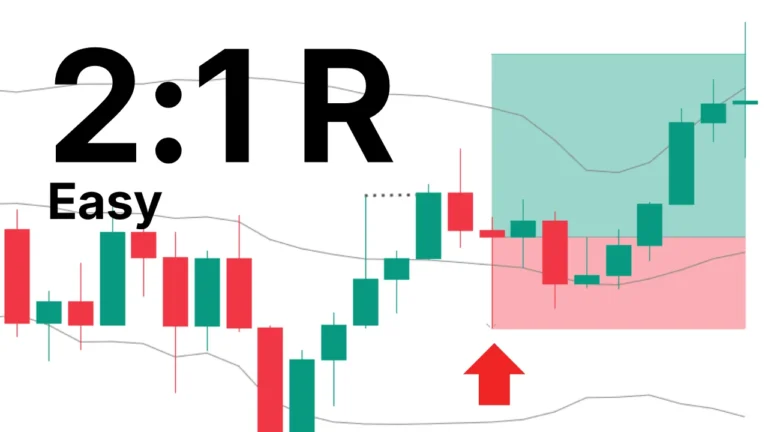
The stop loss is placed below the Fibonacci retracement zone and below the support area shown on the chart. This gives the setup room to move naturally while still defining risk clearly.
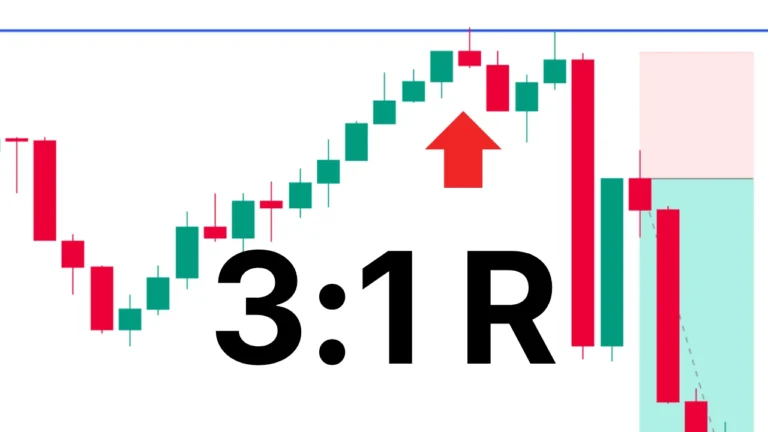
The take profit target follows a 3:1 risk-to-reward structure.
This means the potential reward is three times larger than the defined risk.
Risk-to-reward ratios help traders structure trades logically instead of reacting emotionally during market movement.
Different setups may use different targets depending on volatility, structure, and momentum.
👀 Replay Observation
The replay shows how price initially hesitates around the 0.618 retracement area before buyers slowly regain control.
After the rejection candle forms, bullish momentum begins to return. The market then continues higher and reaches the 3:1 target area shown on the chart.
One important observation is that the continuation does not happen instantly. Price spends some time building structure around support before expanding upward again.
This creates a cleaner and more realistic replay example compared to aggressive one-directional movement.
The replay also shows how pullbacks can remain controlled inside a larger bullish structure.
📚 Educational Perspective
This fibonacci trading strategy example is meant for observation and educational purposes only.
No setup guarantees future market behavior, and real trading conditions will always vary.
The purpose of the replay is to study:
- pullback structure
- Fibonacci reactions
- support behavior
- rejection candles
- continuation movement
Simple chart observation can help traders better understand how markets sometimes move around important areas.
🔗 Next
View more examples in: