Previous Day High Low Strategy – Previous Day High Sweep and Fair Value Gap Rejection
The Previous Day High Low Strategy is a popular way to study how price reacts around important daily reference levels. Many traders watch the previous day high and previous day low because these areas often attract liquidity before the market chooses a direction.
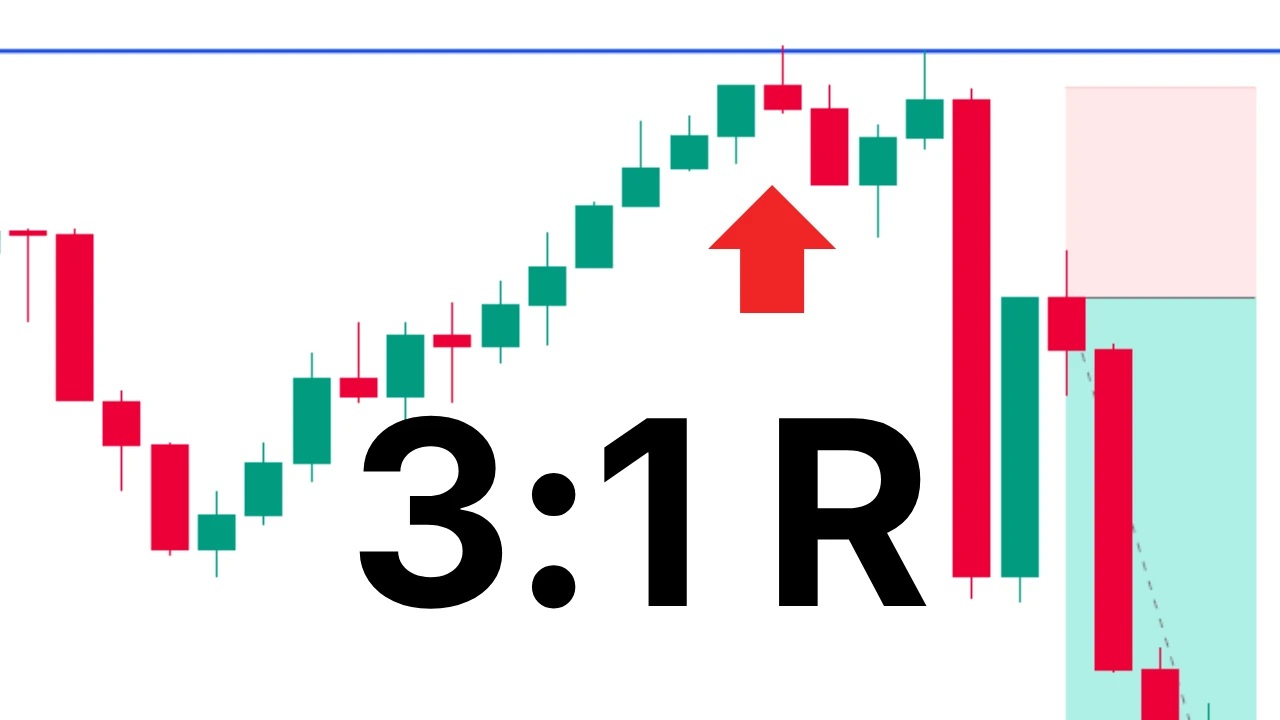
In this replay, price moves above the previous day high before reversing lower. The video demonstrates how a liquidity sweep, a break of market structure, and a pullback into a bearish fair value gap can combine into one organized setup.
The goal is not to predict the market but to observe how price behaves around well-known levels.
🎬 Videos
16:9 Replay Video
9:16 Replay Short
📊 Market Context
The market begins by moving toward the previous day high. Since many traders monitor this level, it often becomes an area where liquidity builds.
Price briefly trades above the previous day high, creating what many traders call a buy-side liquidity sweep. Shortly afterward, the market loses bullish momentum and breaks structure to the downside.
Rather than entering immediately after the move, the replay waits for a controlled pullback.
📈 Setup Logic
After the market structure shift, price retraces into a bearish fair value gap.
Some traders watch these gaps because they can represent areas where the market may rebalance before continuing in the new direction.
A rejection candle forms inside the fair value gap, providing confirmation for the setup.
The entry is taken on the close of the rejection candle.
This sequence keeps the process simple:
- Previous Day High
- Liquidity sweep
- Market structure shift
- Pullback
- Fair value gap rejection
- Entry
🛡 Risk Management
Risk management is an important part of every setup.
In this example, the stop loss is placed above the rejection candle. This location keeps the trade invalid if price continues higher instead of respecting the rejection.
The chart uses a 3:1 risk-to-reward target. This means the potential reward is three times larger than the initial risk.
Different traders may choose different targets depending on market conditions, but using a predefined risk-to-reward ratio helps create consistency during replay studies.
👀 Replay Observation
The replay shows price rejecting the fair value gap after the pullback.
Following the rejection, bearish momentum continues and price reaches the projected target.
Watching the replay several times makes it easier to recognize the sequence of events:
- Liquidity sweep
- Structure shift
- Pullback
- Rejection
- Continuation
Over time, studying many examples can help traders become more familiar with recurring market behavior.
📚 Educational Perspective
No trading setup works every time.
Market conditions change from day to day, and similar patterns can produce different outcomes.
The purpose of this replay is simply to observe market structure in a clear and organized way. By reviewing examples like this, traders can better understand how liquidity, structure, and pullbacks may interact around important price levels.
Learning through replay allows traders to focus on the process rather than the outcome of a single trade.
🔗 You Find The Free Indicator Here
TraderUlf Previous Day High Low (PDH/PDL) Alerts
📈 Interactive TradingView Idea
Explore this setup directly on TradingView.